







OEE in Injection Molding: Formula, Benchmarks & MES Setup

Quick Answer
OEE in injection molding is Availability × Performance × Quality, measured against planned production time. A press-only calculation typically overstates the result by 10–18 points, because dryer, chiller and loader stops are never logged. Instrument the auxiliary units, then let a MES attach a reason code to every stop.
Key Takeaways
- OEE is three ratios, not one number. Availability, performance and quality fail differently.
- Press-only OEE overstates by 10–18 points. Auxiliary stops stay invisible to a machine controller.
- Ideal cycle must be the qualified cycle. Nameplate cycle inflates performance and hides speed loss.
- World-class is 85%. Typical molding plants measure 55–70% once losses are coded honestly.
- A MES earns its cost through reason codes. Dashboards without coded losses produce meetings, not fixes.
- Payback lands in 9–18 months. Three OEE points on 20 presses covers a full rollout.
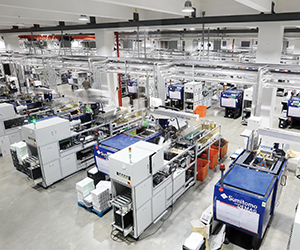
It is the first Monday of the quarter. The plant manager presents 82% OEE for the molding department. Six weeks later a customer audit rebuilds the same cell from shipping records and lands on 64%. Nobody lied. The press counters and the shipping department were counting different things, and that gap is the core problem with OEE in injection molding.
At 2:40 a.m. the same month, a vacuum loader ran empty for 11 minutes. The press stayed in automatic mode with no fault code, so those minutes were booked as run time. A week later a heater bank failed in a mold temperature controller: cycle time drifted to 29.6 seconds, scrap rose to 5%, and the scrap report blamed a material batch.
Each case is a measurement failure before it is a manufacturing failure.
What Is OEE in Injection Molding?
OEE in injection molding is the share of fully good parts a cell produced against the parts it could have produced during planned production time. It is one number built from three independent ratios, so the weakest link caps the result.
- Planned production time = shift length − planned stops (breaks, scheduled maintenance, no-order time).
- Availability = run time ÷ planned production time, where run time excludes unplanned stops.
- Performance = (ideal cycle time × total shots) ÷ run time.
- Quality = good shots ÷ total shots, on first-pass yield rather than after sorting.
OEE = availability × performance × quality. A cell at 90% availability, 92% performance and 97% quality runs at 80.3%. Lose ten points of availability and the same cell drops to 71.4%, which is why stop logging pays first.
The six big losses — breakdowns, setup, small stops, slow cycles, defects, startup rejects — map onto the same three ratios. Benchmarks mean little without a stated method:
| Plant profile | Typical OEE | What caps the number |
|---|---|---|
| Manual cell, no monitoring | 45–58% | Unlogged short stops, no reason codes |
| Well-run plant, press counters only | 62–72% | Auxiliary blind spot, speed loss |
| MES with auxiliary telemetry | 75–82% | Changeover, mold maintenance |
| World-class TPM benchmark | 85%+ | Nothing systematic left to remove |
The 85% figure comes from Nakajima’s TPM work and still stands. Treat it as a direction: a plant that jumps from 58% to 85% in a quarter changed its definitions, not its factory.
Why Does OEE in Injection Molding Usually Read Too High?
Most molding numbers are calculated from the press. That is the blind spot. A machine controller knows its own cycle, alarms and shot counter. It knows nothing about the dryer that drifted off dew point, or the chiller that lost a compressor.
Across plants running 10 to 40 presses, press-reported OEE and OEE rebuilt from auxiliary data usually differ by 10 to 18 points.
| Auxiliary unit | Failure mode | What the press records | Where the loss hides |
|---|---|---|---|
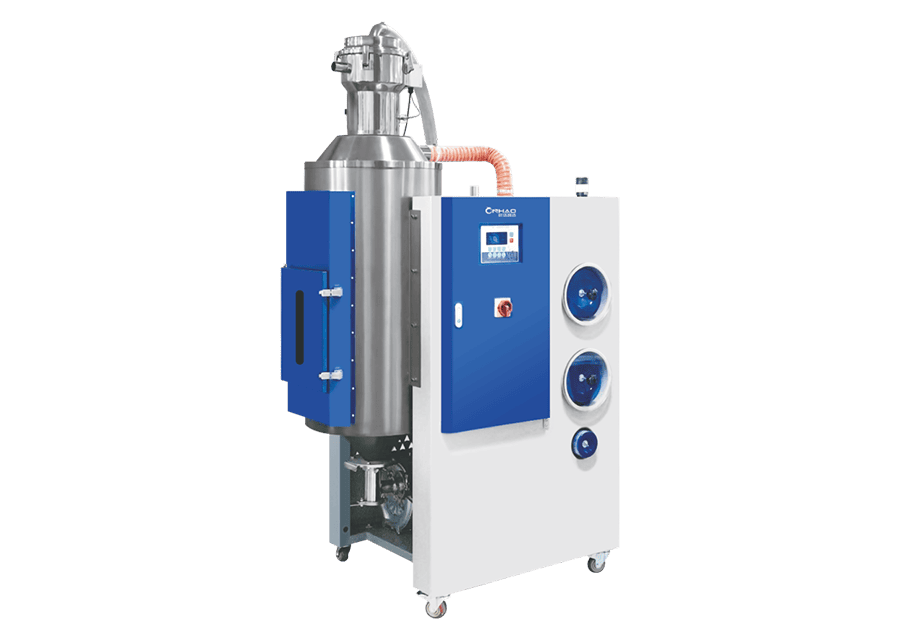
| Resin dryer | Dew point drifts above −20 °C | Nothing | Quality: splay, 2–6% scrap |
| Temperature controller | Heater bank or valve fails | Cycle stretches 0.5–2 s | Performance: slow cycles |
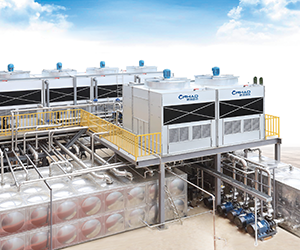
| Chiller or tower | High temperature, low flow | Nothing until overheating | Quality: sink, warp, drift |
| Vacuum loader | Empty hopper, clogged filter | Auto mode, no fault | Availability: 3–15 min stops |
| Granulator | Jam, blocked screen | Nothing | Performance: manual feeding |
Three mechanisms explain the gap. Short stops under two minutes rarely get logged, yet 20 of them cost 30 minutes a shift. Speed loss from marginal cooling looks like a slightly slower cycle. Quality loss masked by sorting reports 99% when first-pass yield is 93%.
Fixing the measurement costs less than fixing the losses: a dew point sensor and a flow switch per loop cost less than one scrapped lot. Streamline Eco Tech specifies dryers, temperature controllers and chillers with signal outputs, since a unit that cannot report its state cannot join an OEE system. See the mold temperature controller guide.
How Do You Calculate OEE for a Molding Cell?
The OEE formula is unforgiving about definitions, so work through five steps in order. Each step produces a number you can audit independently.
- Fix planned production time. Round-the-clock work with two 30-minute breaks and 60 minutes of planned maintenance gives 1,320 minutes.
- Log every stop with a reason code. Six codes cover most cells: no material, mold, machine fault, auxiliary fault, changeover, no operator.
- Set ideal cycle from a qualified run. Use the fastest repeatable cycle that holds quality for a full shift, not the quotation figure.
- Count good shots only. First-pass parts that ship without sorting, rework or regrinding.
- Multiply the three ratios and compare against four-week windows, never a single day.
A 400-ton press runs a two-cavity ABS housing with a 28.0-second qualified cycle. Unplanned stops total 210 minutes, total shots reach 2,180 and 2,096 are good.
- Run time = 1,320 − 210 = 1,110 min, or 66,600 s
- Availability = 1,110 ÷ 1,320 = 84.1%
- Ideal output = 66,600 ÷ 28.0 = 2,379 shots, so performance = 91.6%
- Quality = 2,096 ÷ 2,180 = 96.1%
- OEE = 0.841 × 0.916 × 0.961 = 74.0%
Now audit the same shift with auxiliary data. Twelve short stops of one to three minutes never reach the 210 minutes; add them and availability falls to 81.4%. Chiller drift stretched 340 shots by 1.4 seconds, dropping performance to 89.9%. Sorting removed another 41 parts, so quality falls to 94.2%. True OEE is 68.9%, not 74.0%.
Five points on one press looks like rounding error. Across 20 presses it is 5,500 machine-hours a year, the number for a capital request. The plant energy audit guide covers the power side, since kWh per kilogram and OEE read from the same meters.
What Should an Injection Molding MES Track?
An injection molding MES connects machine signals, auxiliary telemetry, schedule and operator input into one record per shot. Machine monitoring reports what happened; a MES explains why.
Six data sets separate a working injection molding MES from a wall display:
- Machine state — running, stopped, setup or alarm, timestamped from the PLC.
- Shot records — cycle time, injection pressure, cushion, mold temperature, tied to order and mold.
- Auxiliary telemetry — dryer dew point, TCU supply and return temperature, chiller flow, loader cycles.
- Reason codes — chosen at the HMI within a minute of a stop, not typed at shift end.
- Quality events — scrap, rework and sorting, with cavity number where possible.
- Schedule context — order, quantity and due date, so lost time becomes late orders, not percentages.
Two design rules decide whether operators cooperate: reason codes reachable in two taps, and results on the shift’s own screen. Systems that only report upward get quietly sabotaged.
Integration is the hidden cost. Presses built after 2010 usually expose OPC UA or Modbus, while older machines need a tap on cycle and alarm relays. An injection molding MES lives or dies on that work.
Central feeding and drying systems expose far more data than machine-side units, one practical argument for centralizing them — see the smart central feeding system guide. A smart factory project fails the way a quality program fails: data collected, no decision.
How Much Does an OEE and MES Rollout Cost?
Budget bands below cover a 20-press plant with 40 auxiliary units, the size where an injection molding MES starts to pay.
| Item | Scope | Cost band (USD) |
|---|---|---|
| PLC signal kit | Per press: cycle, mold open, alarm relay | $400–$1,200 per machine |
| Auxiliary sensors | Dew point, temperature, flow, level | $150–$450 per unit |
| Edge gateway | Per 5–8 machines | $600–$1,500 |
| MES software | 20 machines, 3 shifts, quality module | $15,000–$80,000 |
| Integration and HMI work | Reason codes, OEE reports, ERP link | $10,000–$40,000 |
| Annual support | License and remote support | $6,000–$25,000 per year |
Mid-band totals land near $103,000 before support: $16,000 of signal kits, $12,000 of sensors, $5,000 of gateways, $45,000 of software and $25,000 of integration.
Twenty presses at 5,500 hours each is 110,000 machine-hours a year, so one OEE point equals 1,100 hours. At a loaded rate of $45 per hour, one point is worth $49,500. Assume half convert into shipped parts, since demand is finite. Three points return about $74,000 against $103,000 of cost, so payback sits near 17 months.
Honesty about the cheap path matters. Under eight presses, a paper reason-code sheet reviewed every morning plus a $300 cycle counter per machine often recovers three points for under $3,000. Discipline does the work, not software. Streamline Eco Tech usually recommends that route first: it builds the habit the software depends on.
Auxiliary spending affects these numbers directly. Units without instrumentation force manual logging, and logging is the first thing a busy shift drops. The auxiliary equipment budget guide covers the hardware side.
What Mistakes Sink OEE and MES Projects?
- Changing definitions mid-project. Planned time, ideal cycle and good-part rules must stay frozen for a quarter.
- Using quotation cycle as ideal cycle. Every performance figure then flatters the plant.
- Counting sorted parts as good parts. First-pass yield is the only quality number that survives an audit.
- Punishing operators with the data. Losses get hidden within two weeks of the first blame meeting.
- Instrumenting presses only. The auxiliary blind spot is where 10–18 points usually sit.
- Reporting daily OEE. A single day swings 20 points on mold changes; compare four-week windows.
FAQ
What is a good OEE for injection molding?
85% is the world-class benchmark, and most molding plants land between 55% and 70% once losses are coded honestly.
How do you calculate OEE in injection molding?
Multiply availability, performance and quality. Availability is run time over planned time, performance is ideal cycle time times shots over run time, and quality is good shots over total.
Can you measure OEE without a MES?
Yes, and under eight presses a paper reason-code sheet plus a cycle counter pays back fastest. A MES becomes necessary when machine count or audit demands exceed manual logging.
What is the difference between OEE and machine utilization?
Utilization only asks whether a machine ran. OEE also asks whether it ran at qualified speed and made good parts, so utilization is always higher, often by 15 to 25 points.
Why is my OEE higher than my actual output?
Because short stops, speed loss and rework are not being recorded. Unlogged stops inflate availability, nameplate cycles inflate performance, and sorting inflates quality.
How long does an OEE and MES rollout take?
Expect 8 to 12 weeks for the first five machines, then 2 to 4 weeks per group of ten. Reason-code adoption needs a full quarter before the data deserves trust.
Bottom Line
OEE in injection molding is a measurement discipline before it is a software purchase. Freeze the definitions, log reason codes at the HMI, instrument dryers, chillers and loaders, and audit ideal cycle time against a qualified run. Do that and the number drops 10 to 18 points: the lower number is the real one, and it is where the money sits.
Streamline Eco Tech builds molding cells where the auxiliary equipment reports its own state, then feeds that telemetry into plant-level OEE reporting. Start with the turnkey plastic auxiliary system overview and ask for a measurement plan with the quotation — the part of OEE in injection molding that decides whether a project survives its second quarter.